Leveraging Big Data to Understand Trail Users
2024 | Western Canada
Historically, trail planning relied on anecdotal user evidence or limited collection methods, such as tickets or sign in registers. More recently, clubs and groups placed infrared counters in strategic locations to know where and when users are recreating; however, these infrared counters have numerous limitations: they are expensive to buy, they only track users passing a single location on a trail, and they require maintenance and ongoing support to harness the data they collect. Most importantly, they can’t discern between an animal, like a dog or a moose, and a person – let alone between nuances like users on bikes versus users hiking.
Occasionally, public engagement was used to collect self-reported trail user data, but this information is notoriously limited and skewed. When McElhanney saw trail clubs and groups struggling to plan for the long-term use of their parks and recreation areas using limited tools like infrared counters and engagement, they challenged themselves to find a better way to gather user data.
“In trail planning, we want to know where people go and what people do,” says McElhanney Recreation Professional, Magi Scallion. “What time of day are users on the trail? What routes are popular? Which trails do locals use and which trails do visitors use, and why?” The McElhanney team set to work to find a data solution that would answer these questions.
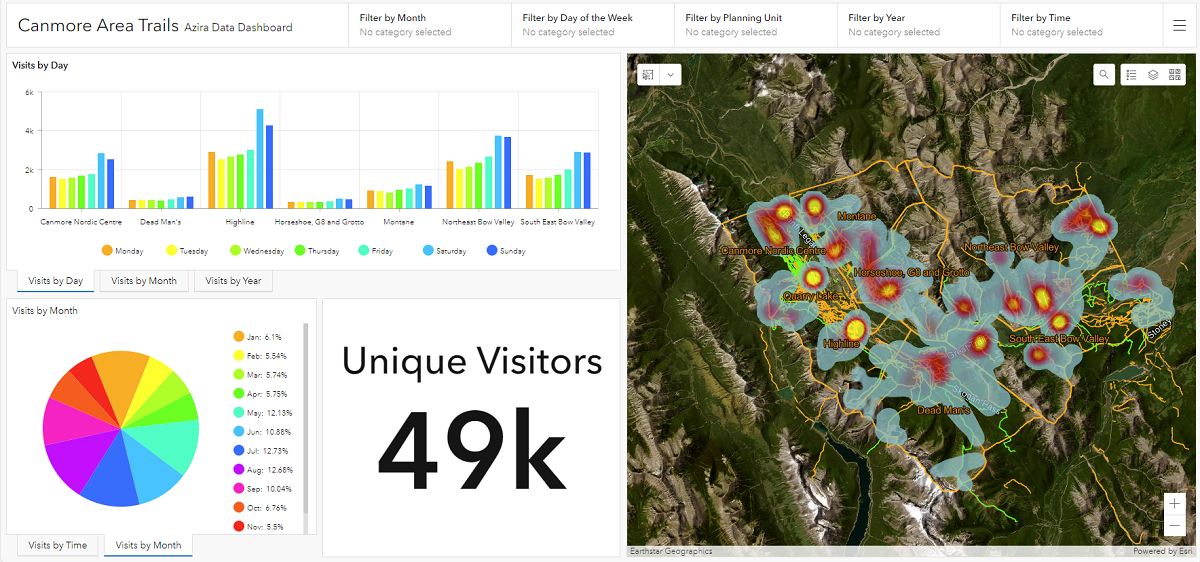
In May 2024, McElhanney’s Trails team presented a new stream of data to the Canmore Area Trail Strategy advisory group, and the group was blown away. This new stream of data was generated from cell phone location tracking services. When McElhanney teams compared the new data stream to their existing data baseline (which was cobbled together from established counting methods like infrared counters, Strava user data, and wildlife cameras), they were impressed with the completeness and accuracy they encountered.
“We have an amazing in-house GIS team,” says Magi Scallion. “We buy our data raw and manipulate it ourselves into a dashboard that lets us see how people are using trails, and when.”
Another benefit to this approach is that McElhanney teams can provide trail groups and clubs with historical user data, whereas infrared counters and wildlife cams only gather data once they’ve been set up. “It’s a huge asset to be able to access historical data,” explains Magi. “Often groups start collecting data at the same time they decide to make a plan, which obviously means the data cannot be used to inform the plan.”
When the McElhanney team began evaluating historical data in the Canmore area, they came across a great discovery in the Mt. Yamnuska hiking trail. Magi Scallion recalls:
“Prior to 2019, the number of rescues in the Yamnuska alpine were averaging between 50-80 per year. McElhanney was engaged to deliver several trail refurbishments between 2020-2021, and the park service saw an immediate decrease in lost hikers and rescues.” Anecdotally, things had improved.
“We were curious about what the user data would show for that area, so we observed the historical data for that Yamnuska prior to 2019. We could see that users would hit the alpine part of the trail and just scatter – you could see they were getting lost. But when we observed the user data for that location after our trail improvements, you could see users reached the alpine and continued like ants in a row. It was incredibly validating to see that our work not only reduced rescue demand, but also improved the environmental impact on the area by streamlining trail use.”
By leveraging big data to understand trail user trends, McElhanney teams are helping trail groups and clubs make sustainable and viable long-term plans for their parks and recreation spaces.
McElhanney provided:
- Dashboard data access
- Data analysis
- Data interpretation
- Recommendations and reporting


